
Application security statistics measure the state of software security across tools, practices, and vulnerabilities. This page presents 50+ original data points from three studies AppSec Santa conducted in February 2026.
Every statistic on this page comes from original research I conducted in February 2026. I tested 6 LLMs for code security, scanned 7,510 websites for security headers, and analyzed GitHub data for 64 open-source AppSec tools.
Key statistics at a glance#
AI-generated code security#
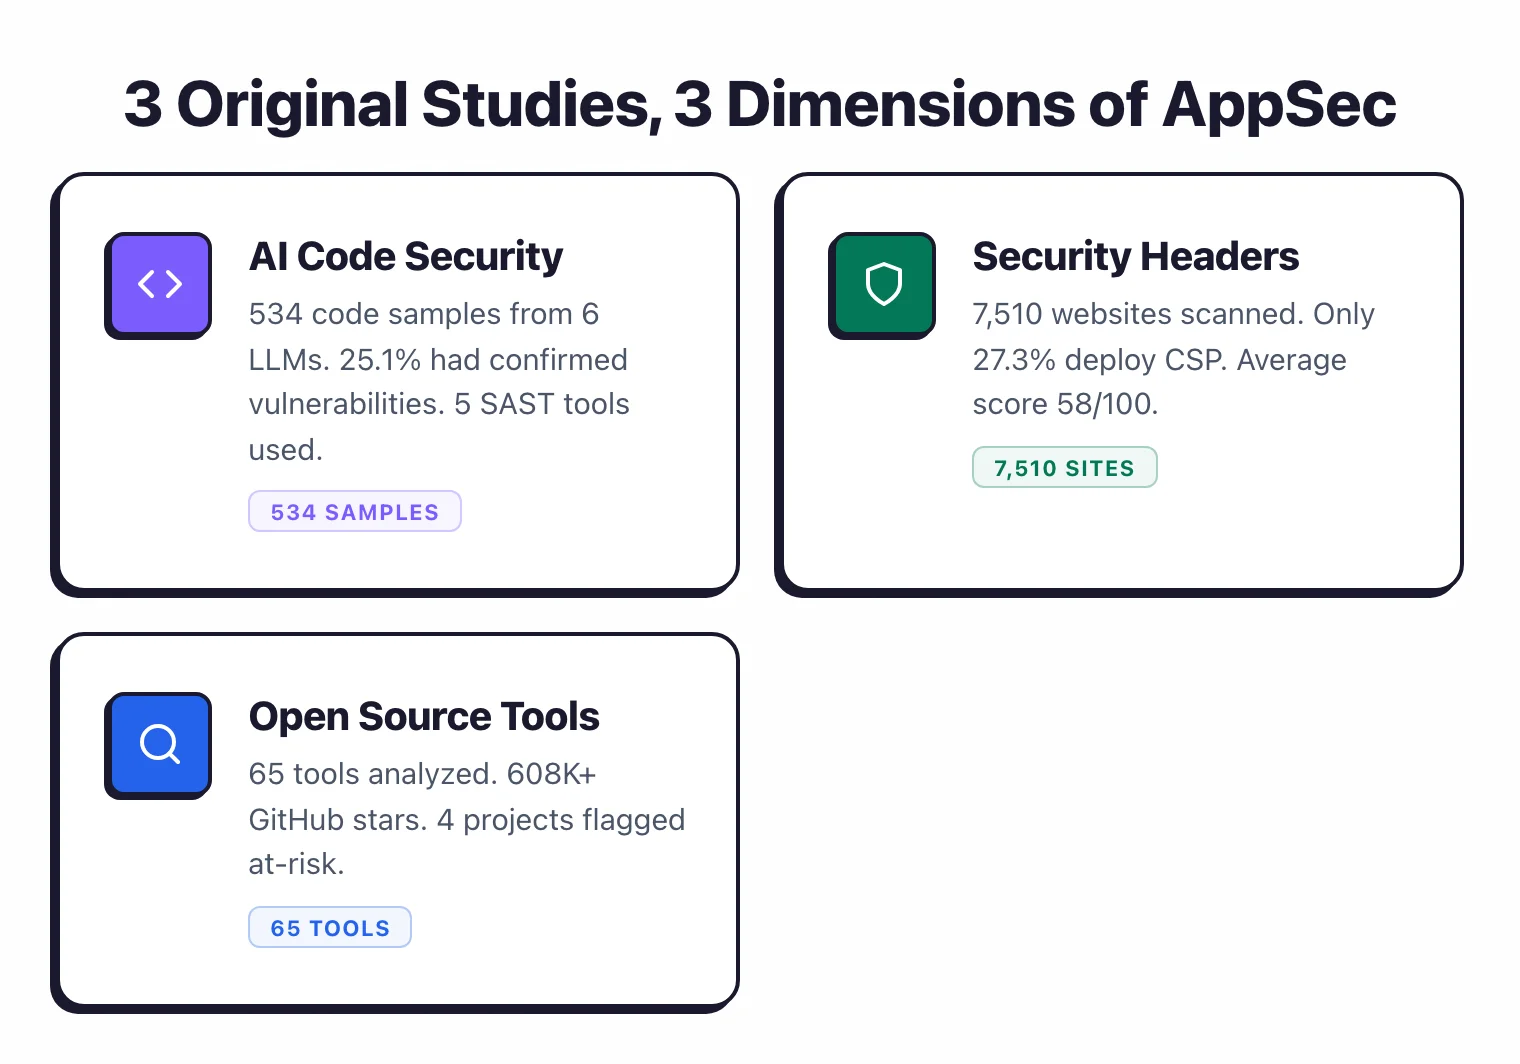
I gave 6 large language models 87 identical coding prompts — building login forms, handling file uploads, querying databases — without mentioning security. Then I scanned all 522 code samples with 5 SAST tools (four open-source plus CodeQL) and validated every finding. Source: AI-Generated Code Security Study 2026 .
Vulnerability rates#
- 25.7% of AI-generated code samples contained at least one confirmed vulnerability
- 522 total code samples tested across 6 LLMs (87 prompts per model)
- 154 confirmed vulnerabilities found after validation of 926 deduplicated SAST findings
- GPT-5.2 had the lowest vulnerability rate at 19.5% (17 out of 87 samples)
- Claude Opus 4.6, DeepSeek V3, and Llama 4 Maverick tied for the highest rate at 29.9%
- Gemini 2.5 Pro came in at 23.0%, Grok 4 at 21.8%
- The gap between the safest and least safe model was roughly 10 percentage points
Most common weaknesses#
- SSRF (CWE-918) was the single most common vulnerability with 32 confirmed instances
- Path traversal (CWE-22/23) was second with 30 confirmed findings
- Injection-pattern weaknesses (SSRF, command injection, NoSQL injection, path traversal) accounted for roughly half of all findings
- Under OWASP Top 10:2025, A01 Broken Access Control led with 65 findings (path traversal + SSRF rolled in), followed by A05 Injection and A10 Mishandling of Exceptional Conditions tied at 22
- Flask debug-on (CWE-215/489) was the second most common pattern after path traversal at 18 findings
- Deserialization of untrusted data (CWE-502) contributed 14 findings
Language comparison#
- GPT-5.2 showed the widest language gap: 11.6% vulnerability rate in Python vs 27.3% in JavaScript
- Claude Opus 4.6 was the only model where Python performed worse (32.6%) than JavaScript (27.3%)
- Grok 4 had the tightest cross-language gap at 1.7 percentage points
Security headers adoption#
I scanned the Tranco Top 10,000 websites in February 2026 and recorded every security header in their HTTP responses. 7,510 sites returned valid responses. Source: Security Headers Adoption Study 2026 .
Adoption rates#
- 51.7% of top websites have HSTS (Strict-Transport-Security) enabled — the most adopted security header
- 49.5% deploy X-Frame-Options
- 44.4% set X-Content-Type-Options
- 28.4% have a Referrer-Policy
- 27.3% deploy Content-Security-Policy (CSP)
- 14.0% use Permissions-Policy
- 10.0% set Cross-Origin-Opener-Policy (COOP)
- 7.4% deploy Cross-Origin-Embedder-Policy (COEP) — the least adopted header
CSP configuration quality#
- 48.8% of sites with CSP use
unsafe-inline, undermining XSS protection - 42.5% of sites with CSP use
unsafe-eval - Only 16.7% of CSP-adopting sites use nonce-based policies
- Only 12.8% use
strict-dynamic— the modern best practice - 2,049 sites enforce CSP, while 296 use report-only mode
HSTS configuration#
- 71.8% of HSTS sites set a max-age of at least 1 year
- 54.7% include the
includeSubDomainsdirective - 35.7% include the
preloaddirective - 238 sites set a max-age of less than 1 day — too short for meaningful protection
Grade distribution#
- Average Observatory-compatible score: 58 out of 100
- 726 sites earned an A+ grade (9.7%)
- 0.3% received an F grade — down from 55.6% in a 2023 academic study (Kishnani & Das, 3,195 sites)
- The most common grade was D (2,085 sites, 27.8%)
Adoption by site rank#
- Top 100 sites: 41.7% CSP adoption, 68.1% HSTS adoption
- Sites ranked 5,001-10,000: 23.9% CSP adoption, 47.7% HSTS adoption
- CSP adoption drops by nearly half between the top 100 and sites ranked 5,001-10,000
Information leakage#
- 27.1% of sites still send the deprecated X-XSS-Protection header
- 8.6% set Cross-Origin-Resource-Policy (CORP)
Open-source AppSec ecosystem stats#
I pulled GitHub data for 64 open-source application security tools across 8 categories and analyzed stars, forks, contributors, release cadence, issue resolution times, and package downloads. Source: State of Open Source AppSec Tools 2026 .
Community traction#
- 608,000+ combined GitHub stars across all 64 tools
- Ghidra is the most-starred open-source AppSec tool with 64,368 stars
- Jadx (47,291), mitmproxy (42,289), and Trivy (31,910) round out the top four
- Secrets detection tools punch above their weight: Gitleaks (24,912) and TruffleHog (24,563) both rank in the top 10
- Promptfoo (10,463 stars) is the only AI security tool in the top 20
Maintenance health#
- Median health score across all tools: 58 out of 100 (fair)
- 7 tools score above 70 (good): Renovate, Trivy, Nuclei, TruffleHog, Promptfoo, ZAP, and Grype
- 4 tools are flagged as at-risk (health score below 20): Dastardly, w3af, Rebuff, and detect-secrets
- No tool scored above 90
- SCA tools have the highest average category health score at 61.6
Contributors and releases#
- Trivy leads in contributor count with 400+ contributors
- Renovate (432) and Kyverno (415) also have 400+ contributors
- Nikto has the fastest median issue resolution at 0.7 days
- Renovate resolves issues in a median of 0.9 days
Language and license trends#
- 52% of open-source AppSec tools are written in Go or Python
- Go leads with 29.7% (19 tools), followed by Python at 21.5% (14 tools)
- 43% of tools use the Apache-2.0 license
- TypeScript now powers two top-20 tools (Promptfoo and Renovate)
Category breakdown#
- Mobile security tools lead in raw star count (203,997) due to Ghidra, Jadx, mitmproxy, and Frida
- IaC Security has 13 tools with 100,000 combined stars
- SAST has the most tools (16) with 119,881 combined stars
- DAST has the lowest average health score at 40.7
AppSec Santa editorial coverage#
This section is a self-disclosure, not industry data. It records the editorial scope of AppSec Santa research, including both open-source and commercial tools, so readers can see which categories are in the dataset.
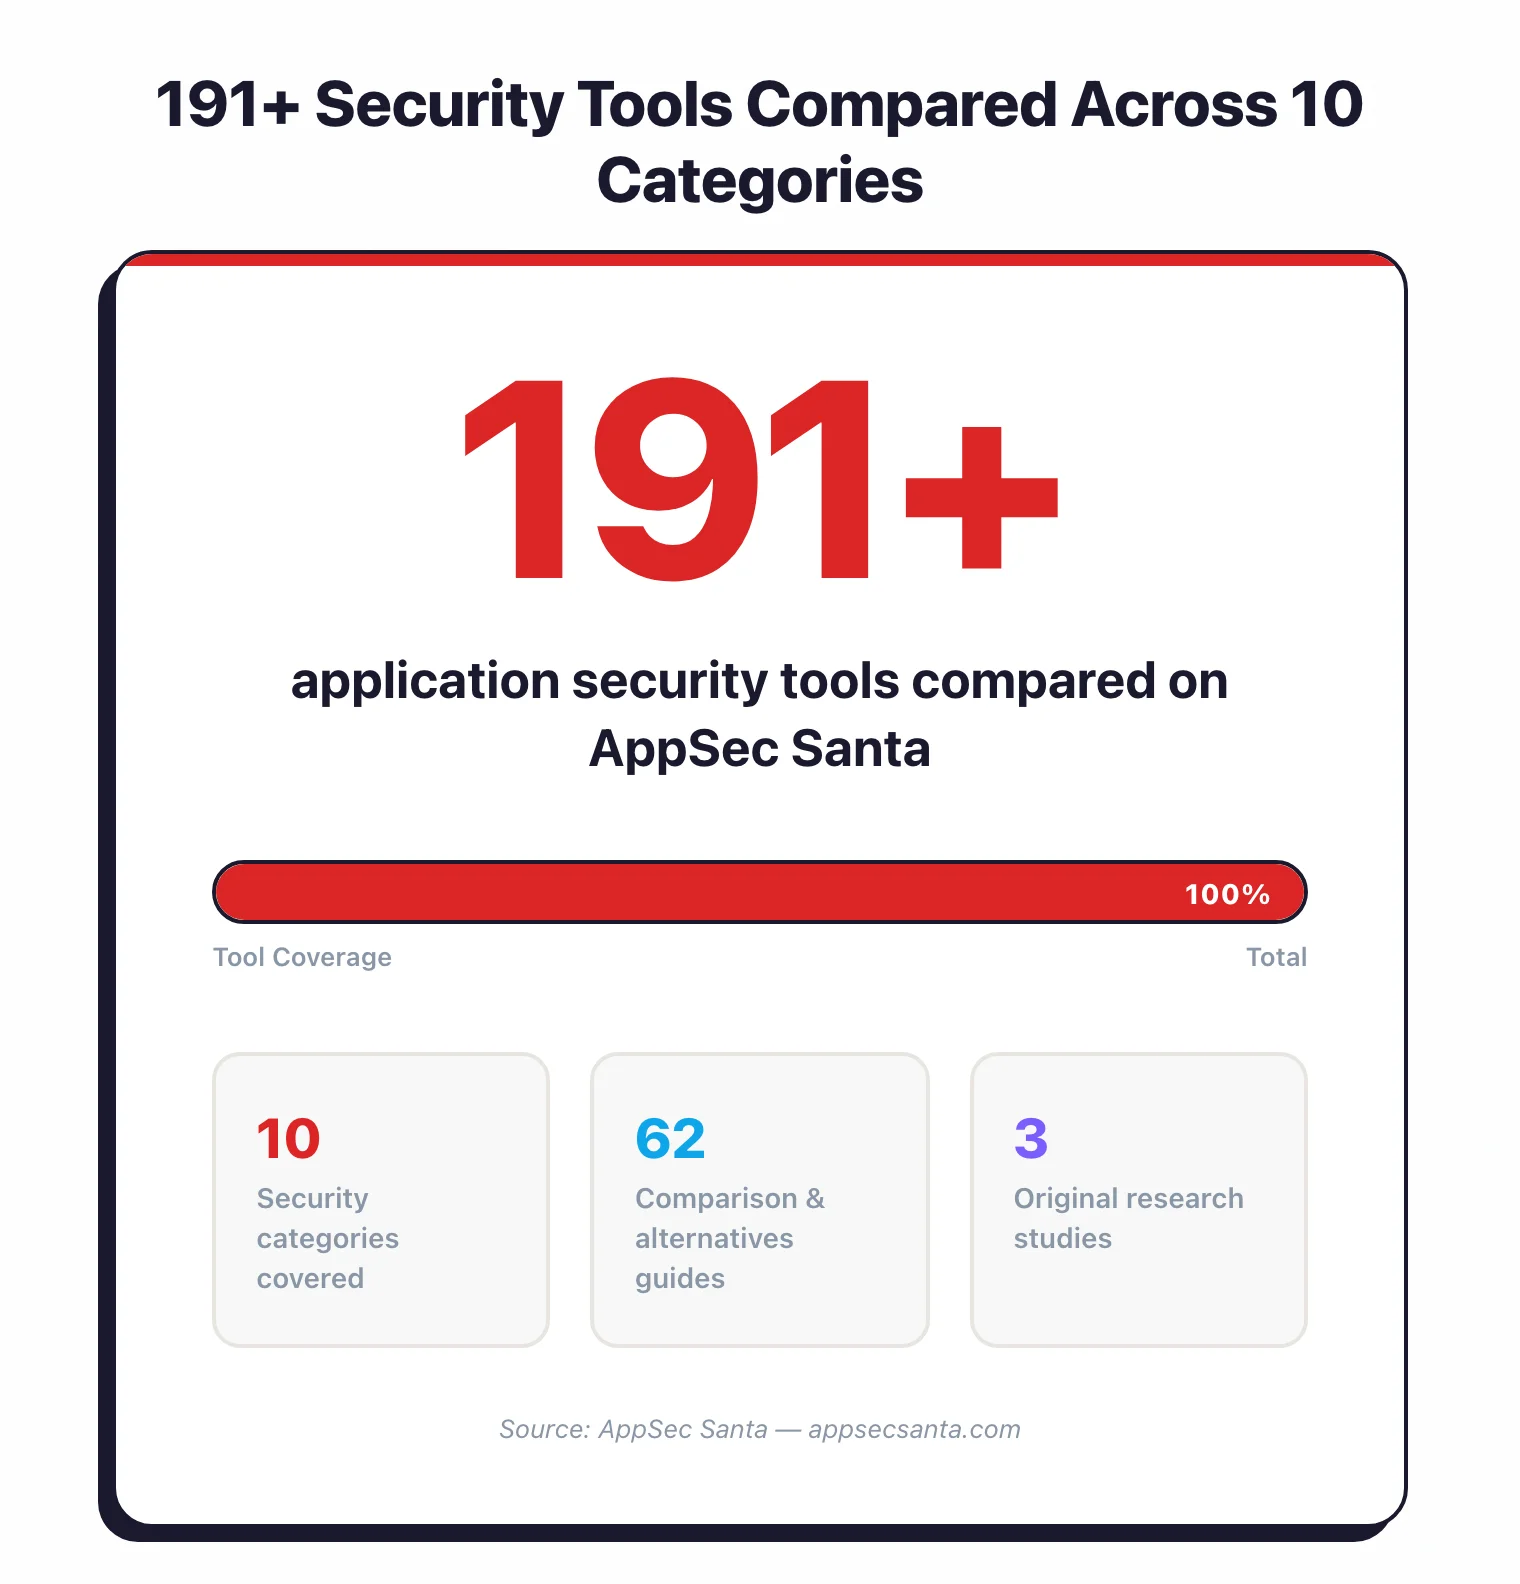
- 247+ security tools compared across 12 categories
- Categories covered: SAST , SCA , DAST , IAST , RASP , AI Security , API Security , IaC Security , ASPM , Mobile Security , Container Security , and Secret Scanning
- 98 comparison and alternatives guides published
- 3 original research studies completed (AI Code Security, Security Headers, Open Source Tools)
Sources & methodology#
Three studies, all conducted in February 2026. No third-party data is used without attribution.
Prior academic work supports why this data matters. Pearce et al. (2022) found that roughly 40% of GitHub Copilot’s output contained security vulnerabilities in their NYU study “Asleep at the Keyboard?” — my 2026 results show the rate has dropped to 25.7% across newer models, but the problem is far from solved.
AI-Generated Code Security Study 2026 522 code samples from 6 LLMs (GPT-5.2, Claude Opus 4.6, Gemini 2.5 Pro, DeepSeek V3, Llama 4 Maverick, Grok 4), tested via OpenRouter API with 87 prompts covering OWASP Top 10 vulnerability classes. Scanned with 5 SAST tools (four open-source plus CodeQL). Every finding validated; final mapping uses OWASP Top 10:2025.
Security Headers Adoption Study 2026 Top 10,000 websites from the Tranco Top Sites list scanned for 10 security headers. 7,510 returned valid HTTP responses (75.1% success rate). Scoring follows the Mozilla HTTP Observatory methodology.
State of Open Source AppSec Tools 2026 GitHub API data for 64 open-source AppSec tools across 8 categories. Metrics include stars, forks, contributors, commit activity, release cadence, issue resolution times, and package downloads from PyPI, npm, and Docker Hub. All data collected February 2026.